Downtime Prevention Through Smart Inventory for Grain Dryers
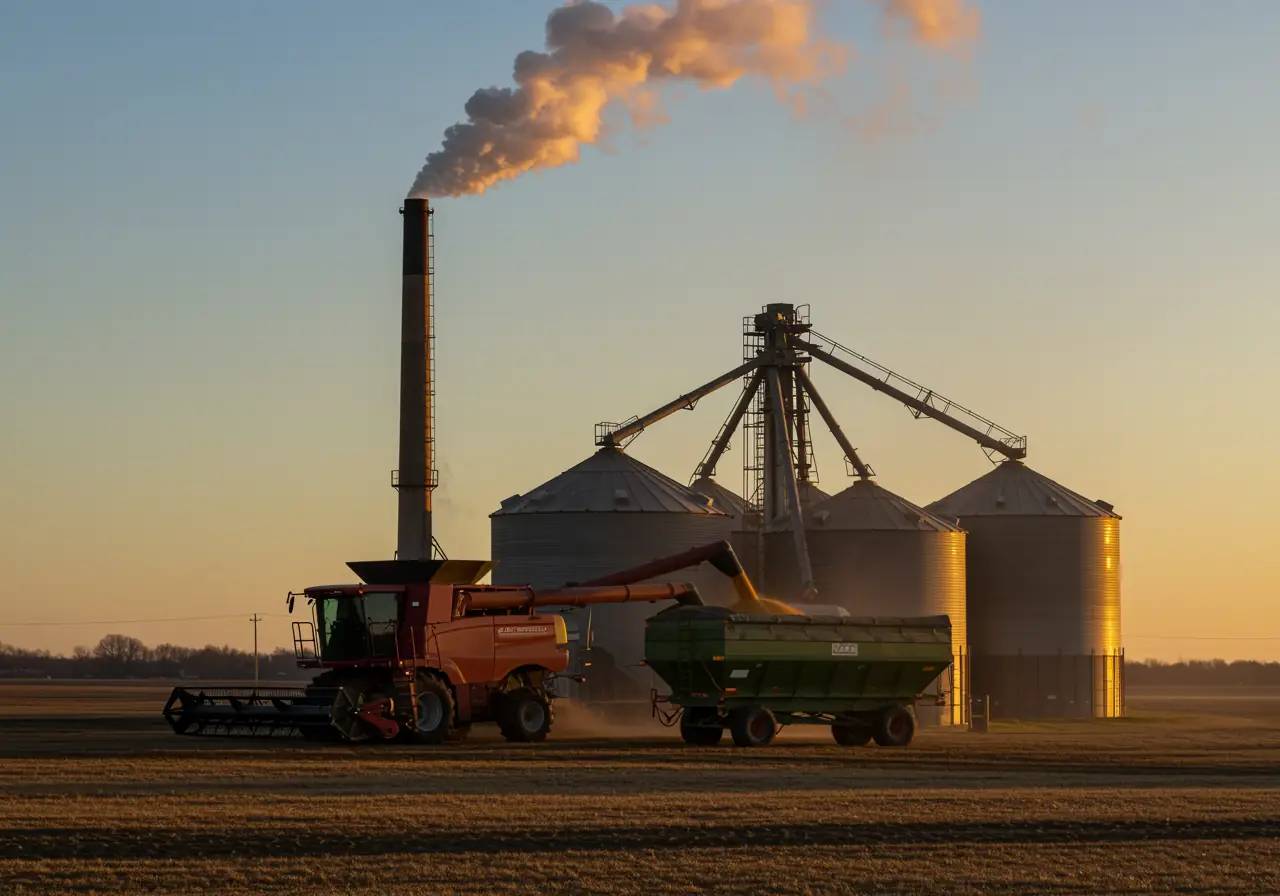
When harvest season hits, every minute of grain dryer downtime translates directly into lost revenue, compromised grain quality, and mounting operational costs. The difference between a profitable season and a financial setback often comes down to one critical factor: having the right parts available at the right time.
Grain dryer downtime prevention isn't just about reactive maintenance - it's about implementing strategic inventory management systems that anticipate failures before they halt your operations. Industry data shows that unplanned equipment breakdowns during peak harvest can cost operators $5,000 to $15,000 per day in lost productivity, emergency shipping fees, and compromised grain quality. Yet most facilities continue operating with outdated, reactive parts management approaches that virtually guarantee these costly disruptions.
This comprehensive guide reveals how smart inventory strategies - from ABC parts categorization to automated reorder systems - can transform your grain drying operation from reactive to proactive, ensuring critical components are always in stock when you need them most.
Understanding Grain Dryer Failure Patterns: The Foundation of Smart Inventory
The Real Cost of Downtime
Equipment failures never occur at convenient times. When your grain dryer stops mid-season, the consequences cascade rapidly: wet grain begins deteriorating within hours, backup at receiving facilities creates bottlenecks across your entire operation, and emergency part orders arrive with premium shipping costs that dwarf the component's actual value.
Equipment problems and failures during harvesting often result in delays, which compounds operational challenges exponentially. Understanding failure rate data is the cornerstone of effective grain dryer downtime prevention.

Critical Failure Rate Data for Grain Dryers
The most frequent failure points in grain drying systems follow predictable patterns:
Bearings and Lubrication Systems (35-40% of failures): More bearings are damaged by overgreasing than undergreasing, with overgreasing damaging seals and creating premature failure. These components typically fail after 2,000-3,000 operating hours without proper maintenance, making them prime candidates for proactive replacement.
Electrical Components (25-30% of failures): Control panels, wiring connections, and motor systems degrade progressively through heat cycles, dust exposure, and moisture infiltration. Wiring insulation degrades, terminals loosen, and contacts corrode - none of it happens overnight, but it only takes one weak point to shut down a dryer when demand increases.
Belts and Drive Systems (15-20% of failures): During downtime, belts may lose proper tension required for safe operation. Belt failure represents one of the fastest repairs if parts are immediately available, but among the costliest delays when emergency ordering is required.
Burner and Heat Systems (10-15% of failures): Gas valves, ignition systems, and burner components experience thermal stress that accelerates wear patterns. These failures often coincide with temperature extremes during peak season.

Translating Failure Data into Inventory Strategy
This failure rate data directly informs which parts should occupy your highest inventory priority. Components with high failure rates, long lead times, and critical operational impact deserve premium inventory treatment - a principle that ABC analysis makes actionable.
ABC Parts Categorization: The 80/20 Rule for Grain Dryer Components
What is ABC Analysis?
ABC parts categorization applies the Pareto Principle to inventory management, recognizing that approximately 80% of a company's total inventory value is often concentrated in just 20% of its items. For grain drying operations, this means identifying which components drive the highest operational impact and allocating management resources accordingly.

Category A Parts: Critical Components Requiring Tight Control
Category A items represent approximately 20% of your parts inventory but account for 80% of your total parts value and operational impact. For grain dryers, this category includes:
- High-value motor assemblies ($2,000-$8,000)
- Control panel systems and PLCs ($1,500-$6,000)
- Specialized burner assemblies ($1,200-$4,500)
- Main drive gearboxes ($1,800-$5,000)
A-items require strict monitoring, accurate demand forecasting, and controlled purchasing because shortages can cause major disruptions. These components demand:
- Precise inventory tracking: Know exactly how many are in stock and their condition
- Dual sourcing strategies: Identify backup suppliers to mitigate supply chain risks
- Scheduled inspection protocols: Proactive assessment prevents surprise failures
- Strategic safety stock: Maintain at least one backup unit for systems with single points of failure
Category B Parts: Moderate-Impact Components
Category B items constitute roughly 30% of parts inventory and 15% of total value. These include:
- Standard bearings ($100-$500)
- Belts and pulleys ($80-$350)
- Temperature sensors ($75-$250)
- Electrical contactors ($60-$200)
B-category parts require balanced management - tracked regularly but without the intensive oversight of A-items. Implement bi-weekly inventory reviews and maintain safety stock covering 2-3 weeks of typical usage.
Category C Parts: High-Volume, Low-Impact Items
Category C items make up approximately 50% of parts inventory but only 5% of total value. Examples include:
- Fasteners and hardware ($2-$20)
- Lubricants ($15-$45)
- Filters ($8-$35)
- Cleaning supplies ($5-$25)
C-items are stocked in large quantities with minimal oversight since shortages don't disrupt operations. Order these in bulk quarterly or semi-annually to minimize transaction costs.

Implementing ABC Analysis: Step-by-Step
- Calculate Annual Consumption Value: Multiply each part's unit cost by annual usage quantity
- Rank Components: Sort all parts by consumption value in descending order
- Apply 80/15/5 Distribution: Group parts accounting for 80% of total inventory value as 'A' items, the next 15% as 'B' items, and remaining items as 'C'
- Assign Management Protocols: Define specific ordering, tracking, and review procedures for each category
- Review Quarterly: Adjust classifications as usage patterns and equipment configurations change
Reorder Point Formula: Mathematical Precision for Inventory Management
Why Reorder Points Matter
Determining exactly when to order replacement parts eliminates both stockouts and excess inventory carrying costs. The Reorder Point is the specific inventory level at which a new order is triggered to ensure stock is replenished before it runs out. This data-driven approach replaces guesswork with precision.
The Core Reorder Point Formula
Reorder Point (ROP) = (Average Daily Usage × Lead Time in Days) + Safety Stock
This formula answers the critical question: At what inventory level should you place your next order to ensure parts arrive before you run out?
Calculating Average Daily Usage
Average daily usage represents how quickly you consume a specific part under typical operating conditions. For grain dryers operating during harvest season:
Example: If you replace conveyor belts three times per season during a 90-day harvest period:
- Annual usage: 3 belts
- Operating days: 90 days
- Average daily usage: 3 ÷ 90 = 0.033 belts per day

Understanding Lead Time
Lead time encompasses the complete duration from order placement to parts availability for installation:
- Order processing: 1 day
- Supplier fulfillment: 3-5 days
- Shipping transit: 2-7 days (standard) or 1-2 days (expedited)
- Receiving and inspection: 1 day
Total typical lead time: 7-14 days for standard shipping, 3-5 days for expedited
Suppliers rarely deliver with perfect consistency - production delays, shipping issues, and customs holdups can extend actual lead times beyond averages. Always calculate using realistic, not optimistic, lead times.
Determining Safety Stock
Safety stock buffers against demand variability and supply chain disruptions. Two approaches work effectively:
Simple Method: Maintain additional days of coverage
- Safety Stock = Average Daily Usage × Safety Days
- For critical A-parts: 7-14 safety days
- For B-parts: 5-7 safety days
- For C-parts: 3-5 safety days (if stocked individually)
Advanced Method: Statistical calculation incorporating demand variability
- Requires historical usage data and standard deviation calculations
- More accurate for high-value Category A components with variable usage patterns
Practical Reorder Point Examples
Example 1: High-Pressure Bearing (Category A)
- Average daily usage: 0.02 units (replacing every 50 days during season)
- Lead time: 10 days
- Safety stock: 14 days of coverage
- Calculation: (0.02 × 10) + (0.02 × 14) = 0.48
- Reorder point: When inventory drops to 1 bearing, place new order
Example 2: Drive Belt (Category B)
- Average daily usage: 0.04 units (one belt per 25 days)
- Lead time: 7 days
- Safety stock: 7 days of coverage
- Calculation: (0.04 × 7) + (0.04 × 7) = 0.56
- Reorder point: When inventory drops to 1 belt, place new order

Implementing Reorder Point Systems
Using reorder points is very easy if you have an inventory management system that gives you real-time visibility of inventory. Options range from simple spreadsheet tracking to sophisticated inventory management software:
Spreadsheet Approach: Maintain current inventory counts and flag items reaching reorder points Inventory Management Software: Automates tracking and generates alerts when reorder points are reached ERP Integration: Enterprise systems connect reorder points with purchasing workflows for seamless procurement
Supplier Diversification: Building Resilient Supply Chains
The Hidden Risk of Single-Source Dependency
Relying on a single supplier creates critical vulnerabilities: when that supplier experiences disruptions, your entire operation faces parts shortages. During the 2020-2022 supply chain crisis, operations with diversified supplier networks maintained 87% uptime while single-source facilities averaged only 62% operational availability.
Strategic Supplier Diversification Framework
Primary Supplier: Your main parts source offering competitive pricing and reliable service Secondary Supplier: Backup option for critical Category A and B components Emergency Supplier: Premium-priced but rapid-response option for urgent situations OEM Direct: Manufacturer relationship for specialized or proprietary components
Qualifying and Managing Multiple Suppliers
Effective diversification requires systematic supplier evaluation:
Quality Verification
- Request certifications and quality documentation
- Order small test quantities before committing to bulk purchases
- Verify parts compatibility with existing equipment
Lead Time Assessment
- Document actual delivery timeframes, not quoted estimates
- Test expedited shipping options before emergency needs arise
- Understand supplier production schedules and capacity constraints
Pricing Structure Analysis
- Compare total landed costs, not just list prices
- Negotiate volume discounts across annual consumption
- Clarify return policies and warranty terms
Category-Specific Diversification Strategies
Category A Parts: Maintain relationships with 2-3 qualified suppliers
- Primary supplier for planned purchases
- Pre-qualified secondary for emergency backup
- OEM direct for genuine components when specifications demand it
Category B Parts: Develop 1-2 reliable sources
- Balance between relationship building and cost efficiency
- Establish backup sourcing for components with longest lead times
Category C Parts: Single supplier with bulk ordering acceptable
- Focus on transaction efficiency over redundancy
- Consider distributor relationships covering multiple product categories
The MCH Parts Advantage in Supplier Diversification
Working with specialized industrial parts sourcing companies like MCH Parts provides instant supplier diversification benefits. Our established network eliminates the time-consuming process of qualifying multiple suppliers independently while ensuring access to quality components when you need them.
Automation Tools: Technology-Driven Inventory Excellence
Why Automation Matters for Grain Dryer Inventory
Manual inventory tracking consumes valuable time, introduces human error, and often fails during the hectic harvest season when precision matters most. Automated inventory management systems transform parts management from a time-intensive liability into a strategic operational advantage.
Essential Automation Features for Grain Dryer Operations
Real-Time Inventory Tracking
- Barcode or RFID scanning for parts receipt and usage
- Digital inventory counts accessible from mobile devices
- Automatic updates eliminating manual data entry errors
Automated Reorder Alerts
- System-generated notifications when inventory reaches reorder points
- Customizable alert thresholds for different part categories
- Multi-channel alerts (email, SMS, dashboard notifications)
Usage Pattern Analysis
- Historical consumption reporting identifying trends
- Seasonal adjustment recommendations
- Predictive analytics forecasting future requirements
Supplier Integration
- Electronic ordering reducing procurement cycle time
- Order status tracking and shipment notifications
- Automated invoice reconciliation streamlining accounting
Automation Options: From Simple to Sophisticated
Entry Level: Enhanced Spreadsheets
- Google Sheets or Excel with automated formulas
- Conditional formatting highlighting items at reorder points
- Shared access for team visibility
- Investment: $0-$50/month
- Best for: Single-location operations under 200 SKUs
Mid-Tier: Cloud Inventory Management Platforms
- Purpose-built inventory software (Sortly, InFlow, Fishbowl)
- Mobile apps for field inventory updates
- Basic reporting and analytics
- Integration with accounting systems
- Investment: $100-$500/month
- Best for: Multi-location facilities, 200-1,000 SKUs
Enterprise Level: ERP Systems
- Comprehensive business management (SAP, Oracle NetSuite)
- Full supply chain integration
- Advanced forecasting and optimization
- Custom workflows and approvals
- Investment: $1,000-$10,000+/month
- Best for: Large operations, 1,000+ SKUs, complex requirements
Implementing Automation Successfully
Phase 1: Data Foundation (Weeks 1-4)
- Catalog all parts with standardized naming conventions
- Photograph components for visual identification
- Document suppliers, lead times, and costs
- Establish baseline inventory counts
Phase 2: System Configuration (Weeks 5-8)
- Input data into chosen automation platform
- Configure reorder points for all tracked items
- Set up alert preferences and workflows
- Train team members on system usage
Phase 3: Refinement and Optimization (Ongoing)
- Review automated recommendations monthly
- Adjust reorder points based on actual usage
- Expand automation to additional components
- Integrate with supplier systems where possible
ROI of Inventory Automation
Research consistently demonstrates compelling returns on inventory automation investment:
- Labor savings: 60-80% reduction in inventory management time
- Inventory optimization: 20-30% reduction in total inventory carrying costs
- Stockout prevention: 85-95% reduction in emergency expedited shipping
- Improved cash flow: Better working capital management through optimized inventory levels
For a typical grain drying facility, automating inventory management often pays for itself within 6-12 months through reduced labor, fewer emergency orders, and minimized downtime.
Integration: Building Your Complete Downtime Prevention System
Connecting All Elements for Maximum Impact
Each strategy - failure data analysis, ABC categorization, reorder point formulas, supplier diversification, and automation - delivers individual benefits. The real power emerges when these elements work together as an integrated grain dryer downtime prevention system.
Your 90-Day Implementation Roadmap
Month 1: Assessment and Foundation
- Week 1-2: Audit current inventory and document all parts
- Week 3: Analyze equipment failure history identifying patterns
- Week 4: Calculate consumption values for ABC categorization
Month 2: System Design and Setup
- Week 5-6: Implement ABC classification with management protocols
- Week 7: Calculate reorder points for Category A and B parts
- Week 8: Qualify backup suppliers for critical components
Month 3: Automation and Refinement
- Week 9-10: Deploy chosen automation platform
- Week 11: Train team on new systems and procedures
- Week 12: Review initial results and adjust parameters
Measuring Success: Key Performance Indicators
Track these metrics to quantify your downtime prevention system's effectiveness:
Primary Metrics
- Unplanned downtime hours: Target 80% reduction year-over-year
- Emergency parts orders: Aim for under 5% of total parts procurement
- Inventory turns: Optimize to 4-6 turns annually for active seasonal operations
- Fill rate: Achieve 95%+ availability for Category A and B parts
Secondary Metrics
- Average order lead time: Monitor trends identifying supplier performance
- Carrying cost percentage: Balance between availability and excess inventory
- Procurement cycle time: Measure efficiency improvements from automation
- Obsolescence rate: Track outdated inventory requiring disposition
Continuous Improvement: Adapting Your System
Your inventory management system should evolve continuously:
Quarterly Reviews
- Reassess ABC categorizations reflecting usage changes
- Update reorder points based on actual lead times and consumption
- Evaluate supplier performance metrics
- Refine automation rules and alert thresholds
Annual Strategic Planning
- Forecast equipment upgrades affecting parts requirements
- Negotiate supplier contracts incorporating volume commitments
- Budget for inventory management technology enhancements
- Assess emerging procurement platforms and methodologies
Conclusion: From Reactive Chaos to Proactive Control
Grain dryer downtime prevention through smart inventory management represents a fundamental shift from costly reactive scrambling to proactive operational excellence. By implementing the strategies outlined in this guide - leveraging failure rate data, applying ABC parts categorization, calculating precise reorder points, diversifying suppliers, and deploying automation tools - your operation transforms inventory management from a persistent challenge into a competitive advantage.
The harvest season will always bring unpredictable variables: weather patterns, grain moisture levels, equipment stress. But parts availability should never be one of those variables. A well-designed inventory management system ensures critical components are always ready, eliminating the panic of mid-season breakdowns and the financial hemorrhaging of expedited shipping costs.
Start with one element: conduct an ABC analysis this month. Calculate reorder points next month. Each incremental improvement reduces vulnerability and builds resilience. Within 90 days, you'll operate with confidence knowing your parts inventory supports rather than jeopardizes your grain drying operation.
The investment in systematic inventory management pays dividends through every harvest season - in preserved grain quality, operational continuity, reduced emergency costs, and the priceless asset of operational peace of mind when your equipment is running at full capacity and your parts crib is properly stocked.
Frequently Asked Questions
What are the most common grain dryer parts that cause unexpected downtime?
The most frequent failure points are bearings and lubrication systems (35-40% of failures), electrical components including control panels and wiring (25-30%), belts and drive systems (15-20%), and burner/heat systems (10-15%). Bearings particularly cause issues because overgreasing can damage seals, creating premature failure. Prioritizing inventory for these high-failure components significantly reduces unexpected downtime.
How much safety stock should I maintain for critical grain dryer components?
Safety stock levels should align with part criticality and supply chain reliability. For Category A critical components, maintain 7-14 days of additional coverage beyond normal lead time demand. Category B parts typically need 5-7 days of safety stock. The formula is: Safety Stock = Average Daily Usage × Safety Days. Account for longer lead times during peak season when suppliers face increased demand.
Can I implement effective inventory management without expensive software?
Yes, absolutely. Entry-level automation using enhanced spreadsheets costs $0-$50 monthly and works effectively for single-location operations managing under 200 part numbers. Start by documenting all parts, calculating reorder points in Excel or Google Sheets, and using conditional formatting to highlight items needing reorder. As your operation grows or complexity increases, transition to dedicated inventory management platforms.
How often should I review and update my parts reorder points?
Conduct quarterly reviews at minimum, with more frequent assessments for Category A critical components. Update reorder points when: supplier lead times change materially, usage patterns shift seasonally, equipment configurations are modified, or you experience stockouts or excess inventory situations. Regular review ensures the reorder point adapts to market and supply chain dynamics.
What's the difference between reorder point and economic order quantity (EOQ)?
Reorder point determines when to order (the inventory level triggering replenishment), while economic order quantity determines how much to order (the optimal quantity balancing ordering costs against carrying costs). Reorder point determines when to place an order based on demand and delivery time, while EOQ determines the optimal order quantity to minimize holding and ordering costs. Both work together for comprehensive inventory optimization.
Should I buy genuine OEM parts or aftermarket alternatives for grain dryers?
The decision depends on part criticality and application. For Category A critical components where failure creates major downtime (motors, control systems, specialized burners), genuine OEM parts provide documented specifications and warranty coverage justifying premium pricing. For Category B and C components (standard bearings, belts, filters), quality aftermarket alternatives from reputable manufacturers often deliver comparable performance at 30-60% cost savings. Always verify compatibility and quality certifications regardless of source.
How can supplier diversification help during peak harvest season?
Supplier diversification creates resilience against supply chain disruptions that intensify during harvest when demand peaks industry-wide. Maintaining qualified relationships with 2-3 suppliers for critical components ensures alternative sources when primary suppliers face capacity constraints or shipping delays. During the 2020-2022 supply chain crisis, diversified operations maintained significantly higher uptime than single-source facilities. Establish these relationships before peak season begins.
What automation features provide the best ROI for grain dryer inventory management?
The highest ROI automation features are: (1) Automated reorder alerts eliminating manual monitoring, (2) Real-time inventory tracking preventing errors and saving labor time, (3) Usage pattern analysis identifying trends for better forecasting, and (4) Mobile access enabling field inventory updates. Start with cloud inventory platforms ($100-$500/month) offering these core features - they typically pay for themselves within 6-12 months through reduced labor, fewer emergency orders, and minimized downtime.
Read More

Engine Air Filter vs. Cabin Filter 2026: EPA Guide

Radiator and Cooling System Parts: NYC Summer 2026

Bucket Teeth Selection 2026: Right Teeth for NYC Soil

Construction Equipment Filters 2026: Complete Replacement Schedule Updated

Track Replacement Guide 2026: How Long Do Undercarriage Parts Really Last?

Final Drive Troubleshooting 2026: 7 Warning Signs Before Complete Failure

Excavator Hydraulic Pump Replacement 2026: OEM vs Aftermarket Complete Guide

Weekend Equipment Breakdown: NYC After-Hours Parts Sourcing Guide 2026

Equipment Down in 2026? Get These 15 Critical Parts in NYC Within 2 Hours

NYC Port Modernization 2026: Heavy Equipment Parts for Hudson River Terminal Upgrades

Queens Is Being Built Right Now - Is Your Equipment Ready?

NYC High-Rise Construction Boom 2026: Parts for Record Number of Tower Projects

Brooklyn Navy Yard Construction: Specialized Parts for Historic Site Work

NYC DOB Construction Equipment Requirements 2026: Updated Parts & Modifications

Equipment Down in 2026? Get These 15 Critical Parts in NYC Within 2 Hours

NYC Winter 2026 Construction: Critical Parts That Fail Below 20°F : Prevention Guide

Prevent Crane Downtime with a Proactive Parts Roadmap

How to Prevent Downtime in Multi-Brand Earthmoving Fleets

How to Source OEM Undercarriage Parts Without Project Delays
Motor Grader Predictive Diagnostics: Prevent Hydraulic Failures & Reduce Downtime
Pesticide Sprayer Calibration: Essential Safety Compliance Guide & Protection

Seeder Bearing Parts Sourcing Guide: Critical Components & Strategy
Downtime Prevention Through Smart Inventory for Grain Dryers

Combine Harvester Breakdown Prevention Guide: Predictive Analytics for Zero Downtime

Master Global Agricultural Parts Delivery | Mid-Season MRO Guide

Fixing Haul Truck Downtime Issues: Remote Parts Strategy Guide 2025

Blasting Equipment Safety Compliance: Must-Know Audit Requirements for 2025

The Step-by-Step Guide to Global Drill Rig Consumables Sourcing

Mining Conveyor Maintenance Guide: Detecting Hidden Risks in Underground Systems

Best Practices for Certified Pipeline Valve Selection: From Specs to Installation

Optimizing Oil Rig PPE Delivery: Proven Strategies That Saved $2M Annually

FPSO Smart Parts Planning: Proven Methods to Cut Downtime

How FPSO Inspection Prevents Million-Dollar Shutdown Losses

Fix It Before It Breaks: A Farmer's Guide to Combine and Harvester Maintenance

Why Fast Tractor Parts Delivery is Changing Modern Farming [2025 Guide]

The Critical Farm Equipment Replacement Parts You Need Before Harvest 2025
.webp)
How to Double Your Farm Efficiency: Expert Guide to Smart Scaling

Cut Costs by 30%: Pre-Season Spare Parts Audit Checklist

Proven Success Factors for Agricultural Equipment Manufacturers in 2025

13 Overlooked Farm Spare Parts That Halt Operations — Pt. 2

13 Overlooked Farm Spare Parts That Halt Operations — Pt. 1

Top Hydraulic Components for Agricultural Equipment in 2025: Complete Guide
The Essential Farm Equipment Parts You Can't Afford to Run Out Of

How to Service Farm Equipment: A Farmer's Guide to Zero Harvest Downtime
Construction Machinery Parts Suppliers: Expert Selection Guide

How to Apply Machine Safety Rules: From Selection to Installation

Smart Diagnostics Cut Heavy Equipment Failures by 73%

5 Ways to Assess the Environmental Impact of Heavy Construction Machinery

10 Smart Ways to Pick Construction Machinery for 2025 Projects

Rent vs Purchase Equipment: What Heavy Industry Experts Hide

How to Implement a Construction Inventory Management System for Equipment Efficiency

How to Extend Equipment Life Expectancy with Regular Maintenance

Advanced Heavy Equipment Diagnostic Tools: Ensuring Construction Machinery Quality
Essential Features Your Construction Equipment Inventory System Needs

29 Quick Tips for Choosing Construction Equipment for Remote Locations

How to Select Construction Machinery with Optimal Equipment Maintenance in Mind

Top 25 Tips for Selecting Bulldozers for Construction Sites

Which Construction Loader is Best for Your Project Needs?

4 Key Steps to Form a Construction Machinery QC Team

15 Essential Tips for Selecting the Perfect Crane for Construction

Maximize Savings: Multi-Purpose Construction Machinery for Lower Costs

Affordable Heavy Equipment Parts: A Sourcing Guide

Choosing the Right Road Construction Equipment: A Complete Guide

Motor Graders: Key Elements to Consider for Optimal Selection

A Detailed Guide to Choosing Excavators for Construction Work

Top Tips for Choosing Cranes for Construction Projects
5 Top-Rated Demolition Machines for Construction Professionals

Expert Tips on Choosing Earthmoving Equipment for Large Projects
Top Functional Criteria for Selecting Heavy Construction Equipment

Construction Machinery: Detailed Guide to Equipment Specifications

Heavy Machinery Prices: Key Factors in Cost and Quality Balance

Best Construction Heavy Equipment Brands: Pros and Cons

Construction Site Equipment: How to Determine Your Requirements

Maximizing Safety: Risk Management for Construction Projects

Innovations in Construction: Transforming Machinery and Equipment

Heavy Equipment Safety: Beyond the Basics in Construction Compliance

The Essential Handbook for Construction Equipment Repair and Maintenance

How to Efficiently Source Oil and Gas Machinery Parts in NYC

Essential Guide to Sourcing Agriculture Equipment Parts

How to Source Mining Machinery Parts: Tips and Strategies